How Many People Work in Residential Construction in Your State?
According to the latest American Community Survey, 11.2 million people — including self-employed workers — worked in construction in 2022. NAHB estimates that, out of this total, 4.7 million people worked in residential construction, accounting for 2.9% of the U.S. employed civilian labor force.
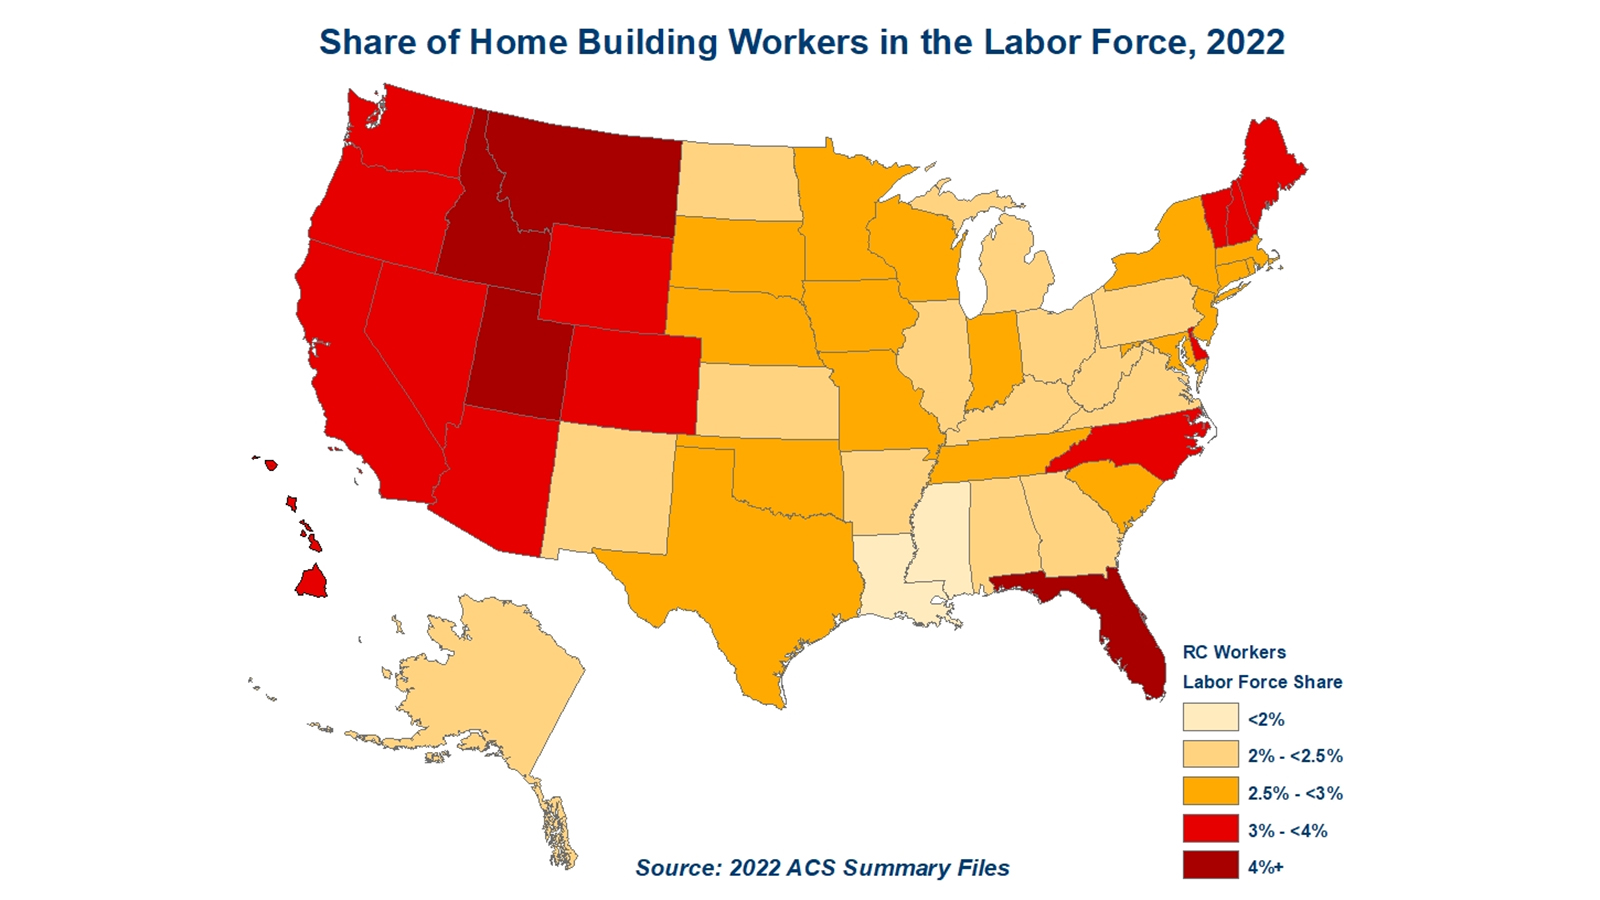
Not surprisingly, the most populous state — California — also has the most residential construction workers. Over 650,000 California residents worked in home building in 2022, accounting for 3.4% of the state employed labor force.
In terms of percentages, fast-growing states with a high prevalence of seasonal, vacation homes top the list of states with the highest share of residential construction workers in 2022. Three states in the Mountain Division — Idaho, Utah, and Montana — take the top spots on the list with 5.9%, 5.4% and 4.8%, respectively, of the employed labor force working in home building. Florida — which has registered one of the fastest growing populations since the start of the pandemic — is next on the list with a share of 4.4%, down from its peak in 2006 at 6.5%.
In addition, 10 other states register shares of residential construction workers that approach 4%:
- Maine (3.9%),
- Wyoming (3.8%),
- Vermont (3.8%),
- Washington, Colorado, New Hampshire and Nevada (3.7%), and
- Arizona, North Carolina, and Oregon (3.5%).
NAHB’s analysis also identifies congressional districts where home building accounts for particularly high employment levels and share of local jobs. As of 2022, the average congressional district has about 10,800 residents working in residential construction, but that number is often significantly higher. For example, in Idaho’s 1st Congressional District, more than 29,000 residents are in home building, and Idaho’s 2nd Congressional District has close to 25,000 residents working in home building.
Eight other congressional districts have over 20,000 residents working in residential construction:
- Florida’s 26th Congressional District (24,700),
- Utah’s 4th Congressional District (24,500),
- Utah’s 2nd Congressional District (24,300),
- Florida’s 17th Congressional District (21,400),
- Utah’s 1st Congressional District (20,600),
- Florida’s 7th Congressional District (20,500),
- California’s 29th Congressional District (20,400), and
- Colorado 8th Congressional District (20,100).
By design, Congressional districts are drawn to represent roughly the same number of people. So generally, large numbers of residential construction workers translate into high shares of residential construction workers in their district employed labor forces.
Natalia Siniavskaia, assistant vice president for housing policy research at NAHB, provides more details and analysis in this Eye on Housing post.
Latest from NAHBNow
Sustainability and Green Building | Multifamily
Jul 30, 2026
New Certification Makes NGBS Compliance Easier for Multifamily ProjectsA new compliance option in the 2025 National Green Building Standard® (NGBS) is designed to make it even easier to showcase how high-performance features have been incorporated into certain multifamily projects.
Economics
Jul 29, 2026
Fed Holds Rates as Inflation and Energy Costs Cloud OutlookThe Federal Reserve opted to keep its key interest rate unchanged on Wednesday, while signaling that additional rate increases remain possible if inflation does not continue to ease.
Latest Economic News
Economics
Jul 30, 2026
PCE Inflation Eased in JuneAfter reaching a three-year high last month, the Federal Reserve’s preferred inflation gauge eased in June following declines in energy prices amid a temporary truce with Iran. This marked the first monthly decline in six years.
Economics
Jul 30, 2026
Top Ten Builder Share Across Largest Housing MarketsAn earlier post described how the top ten builders in the country accounted for 43.6% of new single-family closings in 2025. BUILDER magazine has now released additional data on the top ten builders within each of the 50 largest new home markets in the U.S., ranked by single-family permits.
Economics
Jul 29, 2026
Amid Supply-Side Inflation Pressures, The Fed HoldsThe Federal Reserve held the federal funds rate at a target range of 3.5% to 3.75% at the conclusion of its July policy meeting. There were three dissenting votes on the Federal Open Market Committee (FOMC), all of which supported raising the federal funds rate by 25 basis points.